- Hyper Cities of Berlin and Rome - Visit a city at any time and point. Brings together old maps and new to give location a temporal context.
- Geocodr - geocode places and events using tags and descriptions of photos on Flickr.com
- Plundr - location aware gaming for the PC and Nintendo DS
- iFind - location based social software on MIT campus
- Polytransit - Like OpenMap, create open source transit and transportation mapping site
- GPS-enabled shoes
- World without Oil
- WayMarkr- self-documenting wearable device with unlimited disk space. Another way to document one's life.
- Mobzombies - A game where you run away from 8-bit zombies by actually running. Your actual position controls you character and gameplay
- Voicing the Earth - adding sound to Google Earth
- Continental Divide Trail Project - mapping the Continental Divide Trail
- backpacker.com/hikes/cdt
- Serendipity - UCLA software that records changing map of Bluetooth devices near a mobile user...social analysis
- mscapers.com - tools for developing immersive games/environments
Tuesday, May 29, 2007
where fair
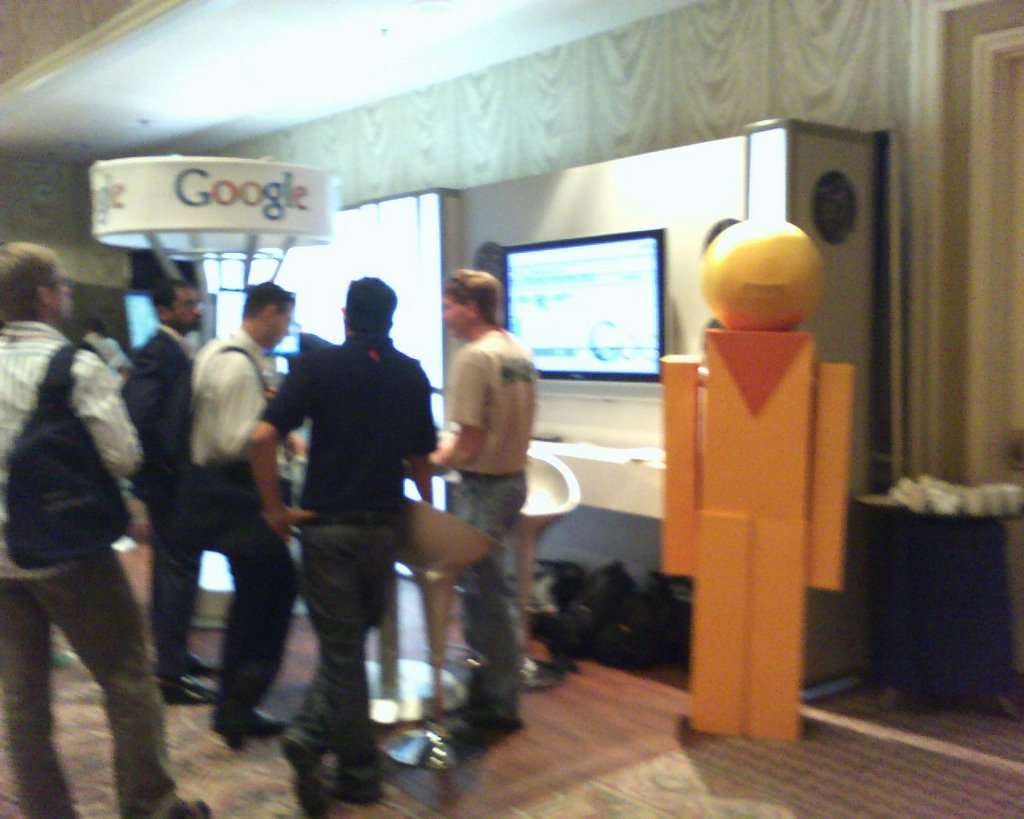
After the evening reception in the exhibit hall, I checked out the Where Fair.
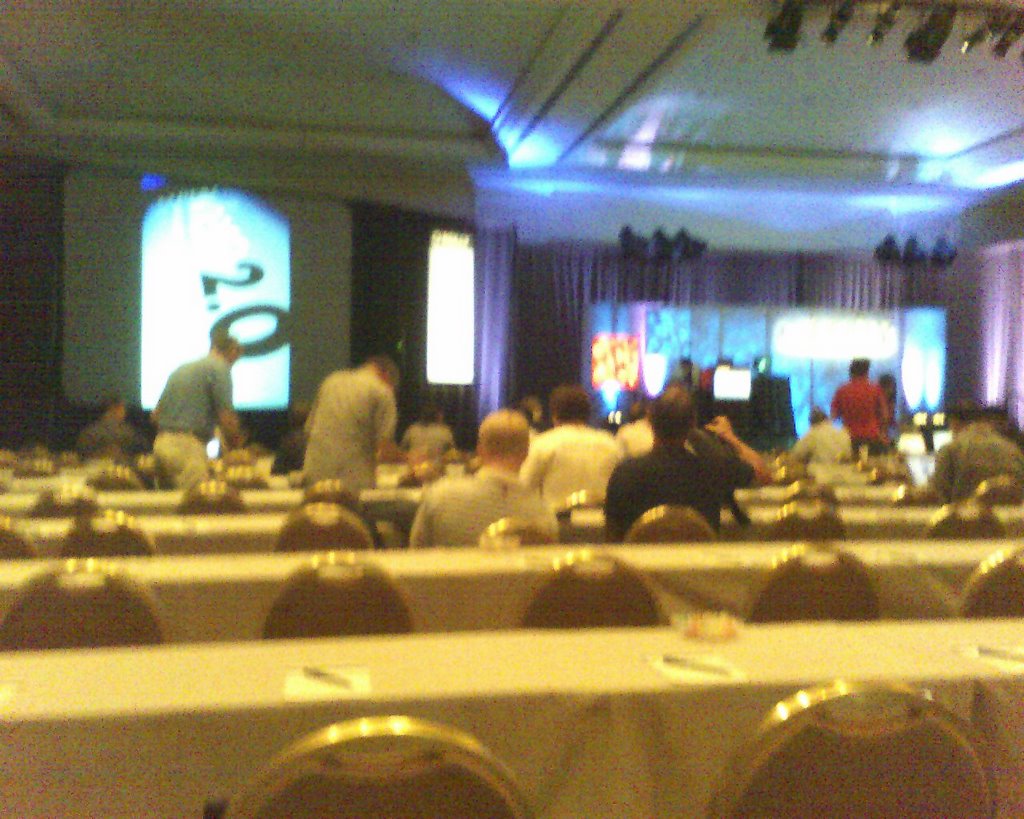
afternoon sessions day one
Five-person panels starts things off. We have:
The next interesting topic was from Bernie Krause from Wildlife Sanctuary with Giving Voice to the Map. He talks about adding sound to locations. For example you can click on an area in Google Earth and hear the ambient environmental sounds in that location.
Garmin is the next one up, and they talk about enabling websites to communicate with GPS devices.
I'm really impressed with their stuff!
Before the afternoon break Erik Jorgensen from Microsoft Local Live Search talked about how they make their 3-D building models.
The next presentations revolved around grass roots science using digital cameras/sensors and GPS units on pigeons (Beatriz de Costa's work) and the Economics of Mash-ups by Di-Ann Eisnor, CEO of Platial.com.
Then there was a lightening round of 3 5-minute presentations:
Steven Johnson, co-founder of outside.in, talked about the start of community mapping during the 1800s in London during Cholera outbreaks.
outside.in pulls information and news about any location you are interested in.
There was just so much information the whole day, I got burned out.
- Don Cooke, TeleAtlas
- Jack Dangermond, ESRI
- Michael Jones, Google
- Stephen Lawler, Microsoft
- David Colleen, Planet 9
The next interesting topic was from Bernie Krause from Wildlife Sanctuary with Giving Voice to the Map. He talks about adding sound to locations. For example you can click on an area in Google Earth and hear the ambient environmental sounds in that location.
- Link - earth.wildsanctuary.com
Garmin is the next one up, and they talk about enabling websites to communicate with GPS devices.
- Links - developer.garmin.com, geocaching.com
I'm really impressed with their stuff!
Before the afternoon break Erik Jorgensen from Microsoft Local Live Search talked about how they make their 3-D building models.
The next presentations revolved around grass roots science using digital cameras/sensors and GPS units on pigeons (Beatriz de Costa's work) and the Economics of Mash-ups by Di-Ann Eisnor, CEO of Platial.com.
Then there was a lightening round of 3 5-minute presentations:
- The development of OpenLayers, an API that can communicate with Google Maps, Yahoo! Maps, Virtual Earth, WMS, WFS, GeoRSS, KML, or data direct from OpenStreetMap.
- GeoBliki: A Platform for Emergency Response
- Graphserver: which is an itinerary engine
Steven Johnson, co-founder of outside.in, talked about the start of community mapping during the 1800s in London during Cholera outbreaks.
outside.in pulls information and news about any location you are interested in.
There was just so much information the whole day, I got burned out.
in the exhibit hall
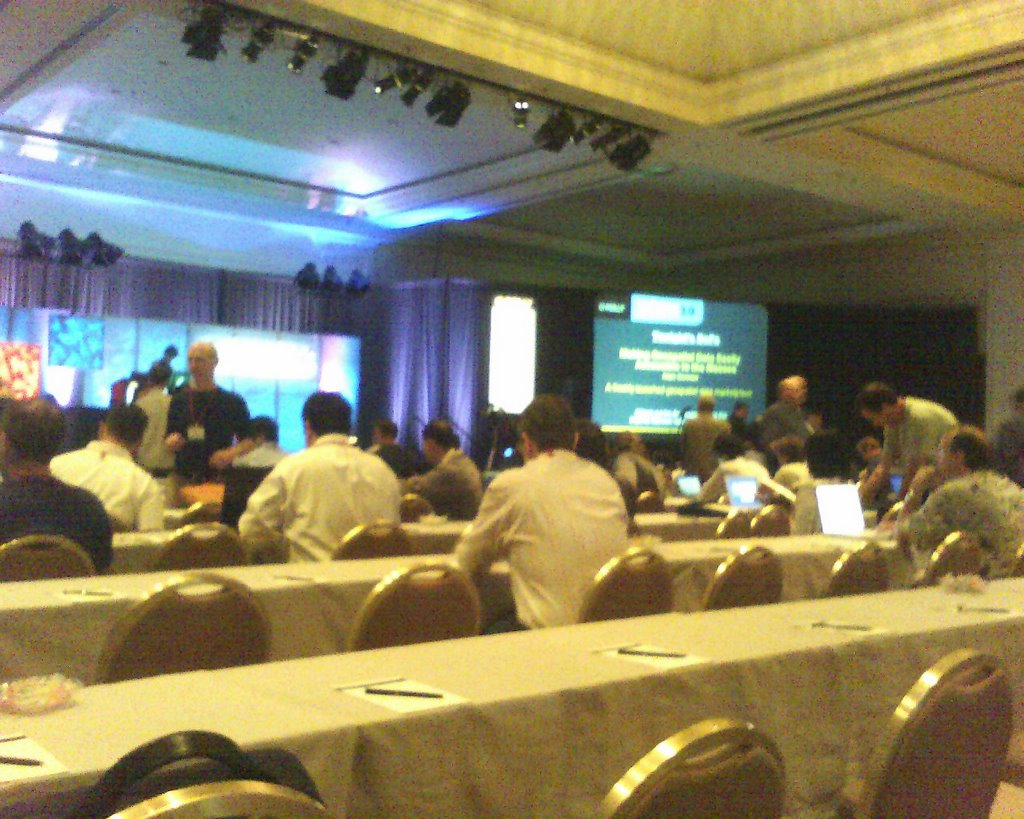
morning sessions day one
Well, I am finally here. I'm in the middle of the first break. some notes:
The next major presentation was on Quakr which tries to build a 3D world from photos placed on Flickr. They are bring in photographs, geolocating them, and then tying them together in a 3D world.
Andrew Turner spoke about the "geostack" (Create, Publish, Aggregate, Consume). He mentioned the following terms, which will have links.
MapQuest's Jim Greiner announced that their ActionScript API had been released. They also surveyed users and found 5 Success Factors for Web applications:
- Business casual dress
- Main session room is set up with AC powerstrips abd free wi-fi so that people can plug in their laptops
- Single-track of presentations
- About 800 attendees
- 44 mapping APIs
- KML turned over to OGC to become a "standard"
- TEchno BPM music playing in the background and in the transitions
- He said that the U.S. has a wealth of public domain information but the availability of it is haphazard, in other words, there is not a central effort to make U.S. gov public domain data EASILY available.
- Other countries don't have this luxury or users are made to pay. He used Great Britain as an example.
- Links of note:
- Demonym - name given to people of a place. (e.g. Hoosiers, Virginian,...)
- Talked about mainstreaming of Geo
- They are investing in their basemap
- User-created data is important.
- Google has opened up StreetView
- Panoramic view of place with the ability to pan and zoom
- State DOTs have something like this -- videologging, but this is more dynamic. this is a potential app. for DOTs
- Sent KML to OGC to make it a more official standard
- Google Mapplets let's you add data to Google Maps, similar to how you may add Google gadgets to iGoogle. Check out maps.google.com/preview
The next major presentation was on Quakr which tries to build a 3D world from photos placed on Flickr. They are bring in photographs, geolocating them, and then tying them together in a 3D world.
Andrew Turner spoke about the "geostack" (Create, Publish, Aggregate, Consume). He mentioned the following terms, which will have links.
- Eye-film
- Platial
- Geopress.org -- geolocate your Wordpress Blog post
- Safe's FME
- Mapufacture
- GeoServer
- OpenLayers
- FreeEarth
- Mapstraction
MapQuest's Jim Greiner announced that their ActionScript API had been released. They also surveyed users and found 5 Success Factors for Web applications:
- Demonstrate the value to the user, then make it the standard
- Once users are informed and shown why features are relevant, their demand increases
- Give the user control
- Provide alternatives to control outcome of map and routing experience. Let them choose what's relevant for them
- Users want to share their personalized maps but in limited ways
- Reinforce the Foundation
- Don't just give data -- help make a decision
- Turn data into intelligience during the user's experience
- Evolve with your users -- help them whereever and whenever
Subscribe to:
Posts (Atom)

